
방사온도계

-
-
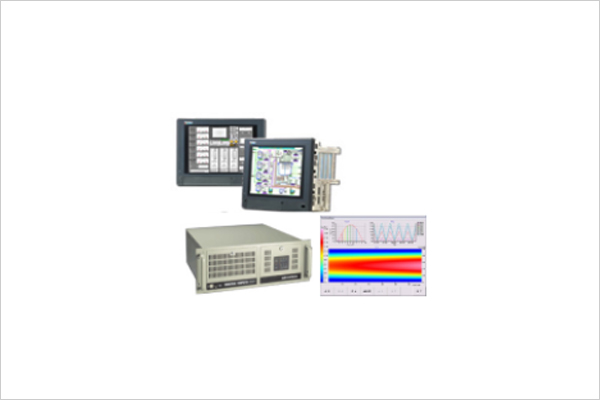
IR-EPG Series
분류
방사온도계/Scan용 방사온도계
제품소개
Scan 방사온도계용 전용 프로세서입니다.
특징
Display/Operation Unit
- IR - EPG : Panel Type - IR - EPG5 : Rackmount Type
기술사양
| Functions | Temperature pattern data measurement, temperature graph, and data storage and output |
|---|---|
| Temperature pattern | The temperature pattern signals output by the detector are processed into the lateral temperature profile data using scanning synchronization signals as triggers. |
| Number of data divisions | 1000 divisions per scan |
| Main screen |
|
| Settings |
|
| Start and stop | Start and stop of measurement using buttons (with replay and maintenance operation disabled during measurement) |
| Storage |
|
| Replay |
|
| Maintenance |
|
| Custom Software (Option) | A service is available to develop data processing software with customized specifications different from the above specifications. |
한국지노(주) 주소: 경기도 화성시 동탄대로 17길 9 (오산동) 연락처: 031-379-3700 이메일: webmaster@chinokorea.com
Copyright ⓒ CHINO All Rights Reserved.